Pomegra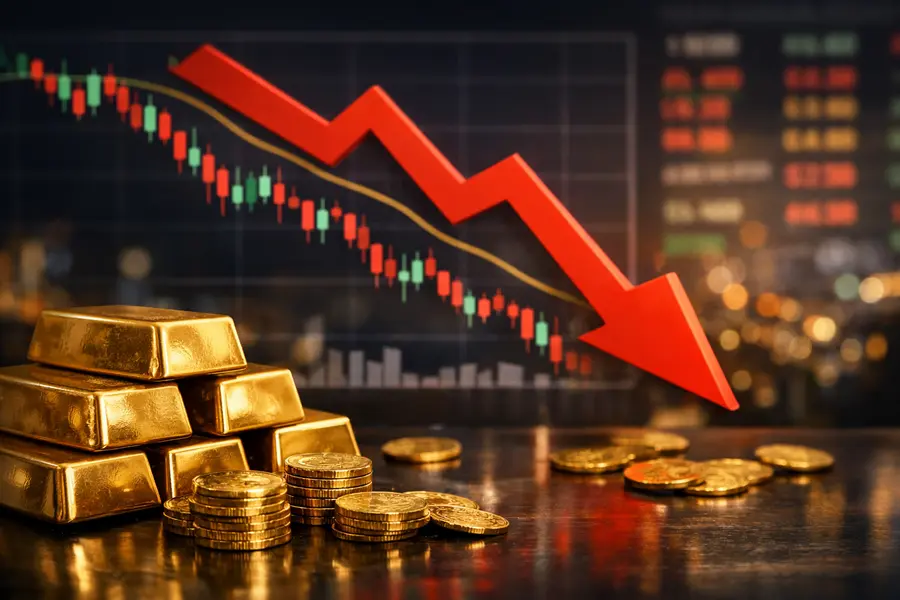
Gold settled at $4,148 per ounce for a fourth straight session as dollar strength and rising Treasury yields keep the metal's 2026 bear market intact and ETF outflows mount.
- Gold spot prices fell to $4,148 per troy ounce Monday, down 0.41%, as the U.S. dollar steadied and 10-year Treasury yields reached 4.50%.
- June U.S. nonfarm payrolls grew by just 57,000 — less than half the 110,000 consensus — trimming but not eliminating Federal Reserve rate-hike odds for September.
- From its all-time high of $5,602 reached January 29, gold has shed nearly 28%, the steepest drawdown since the metal's bear market of 2013.
Lead
Gold posted its fourth consecutive daily loss on Monday, July 7, settling at $4,148 per troy ounce — off 0.41% from the prior session — as the U.S. Dollar Index (DXY) rebounded toward the 101.20 level and the benchmark 10-year Treasury yield climbed to 4.50%, its highest mark in two weeks. The losing streak represents the longest consecutive decline for XAU/USD in a month and extends a correction that has erased $1,454 per ounce since gold's record close of $5,602 in late January.What Happened
Selling intensified during the New York session as dollar bulls reasserted themselves after a brief pullback on weaker-than-expected employment data. Bullion staged an intraday recovery attempt, touching a session high near $4,176, before renewed dollar demand pushed prices back toward session lows near $4,140.
The four-session decline fits within a broader correction that reversed the historic rally gold mounted in late 2025 and early 2026. Bullion shed approximately 14% across the second quarter — the largest quarterly decline since Q2 2013 — as the rate-cut thesis that underpinned the bull case dissolved in the face of sticky U.S. inflation and a more hawkish Federal Reserve posture than markets had priced at the start of the year.
Jobs Data Provides Partial Cushion
Friday's U.S. June nonfarm payrolls report briefly cushioned the metal. Payrolls rose by just 57,000 last month, the smallest gain in four months and well below the consensus estimate of 110,000, with downward revisions to the two prior months compounding the miss.
The soft reading prompted futures markets to scale back Federal Reserve rate-hike bets. The probability of a 25-basis-point increase at the September meeting fell to roughly 50%, down from 66% before the release. Markets are pricing roughly a 75% likelihood of unchanged rates at the July 28–29 FOMC decision.
For gold, the jobs data provided only limited relief. While a slowing labor market reduces the risk of additional tightening, the absence of imminent cuts keeps real yields elevated — sustaining the opportunity cost of holding non-yielding bullion. With the 10-year Treasury yield holding at 4.50% and the two-year yield pushing toward fresh 2026 highs above 4.20%, the rate-differential headwind remains intact.
ETF Outflows Signal Structural Pressure
Demand-side data reinforces the bearish technical setup. U.S.-listed gold ETFs shed approximately $5.3 billion in June 2026 alone, extending a trend that turned global gold ETF demand net negative by roughly 50 metric tonnes across the first half of the year. An estimated 298 tonnes of gold held inside ETFs now sits at a loss at current price levels — a structural ceiling on any near-term recovery as these positions suppress buy interest.
The SPDR Gold Shares ETF (GLD), the world's largest gold-backed fund, has tracked the broader decline, with redemption pressure concentrated during periods of sharpest dollar strength. First-half aggregate global flows — which had flooded into gold ETFs during the January bull run — have now fully reversed.
Dollar and Yield Dynamic
The inverse relationship between gold and the dollar has been the dominant price driver throughout the 2026 correction. Dollar strength reflects market expectations that the Fed will sustain higher rates longer than the deep-cut scenario priced at the start of the year. The DXY slipped briefly below 102 over the July 4 holiday weekend — its lowest since early 2024 — before recovering as softer payroll data repriced expectations without displacing the dollar's yield-differential support.
Bear Market in Context
Spot gold's 28% retreat from the January 29 all-time high of $5,602 qualifies technically as a bear market. The bull case rested on three pillars: expectations of aggressive Fed rate cuts, elevated geopolitical risk premiums tied to Middle East conflict, and sustained central-bank accumulation. All three have softened: the rate-cut timeline has been pushed out, diplomatic de-escalation eroded the geopolitical premium, and ETF demand has turned sharply negative. Mining equities, including Barrick Gold and Newmont, have experienced amplified declines, given their inherent operating leverage to metal prices.What Comes Next
Two near-term catalysts could redefine gold's trajectory. Minutes from the June 16–17 FOMC meeting, released Tuesday, will be parsed for the committee's tolerance toward further tightening if inflation remains above target. The FOMC's July 28–29 rate decision then arrives with consensus firmly expecting a hold, though any hawkish dissent in the minutes could accelerate selling. On the upside, a material downshift in inflation data or a sharper-than-expected deterioration in the labor market would be required to rebuild the rate-cut narrative that initially drove gold to record territory.
Outlook
The four-session losing streak underscores gold's structural vulnerability at current levels. Elevated real yields, a resilient dollar, persistent ETF outflows, and underwater ETF positions above $4,000 combine to limit the scope of any near-term recovery. The $4,000-per-ounce level represents the next significant technical and psychological threshold. A durable reversal requires either a credible shift in Fed rate guidance or a renewed surge in safe-haven demand — neither of which appears imminent based on current macro conditions.
Mentioned tickers: GLD, IAU, GOLD, NEM