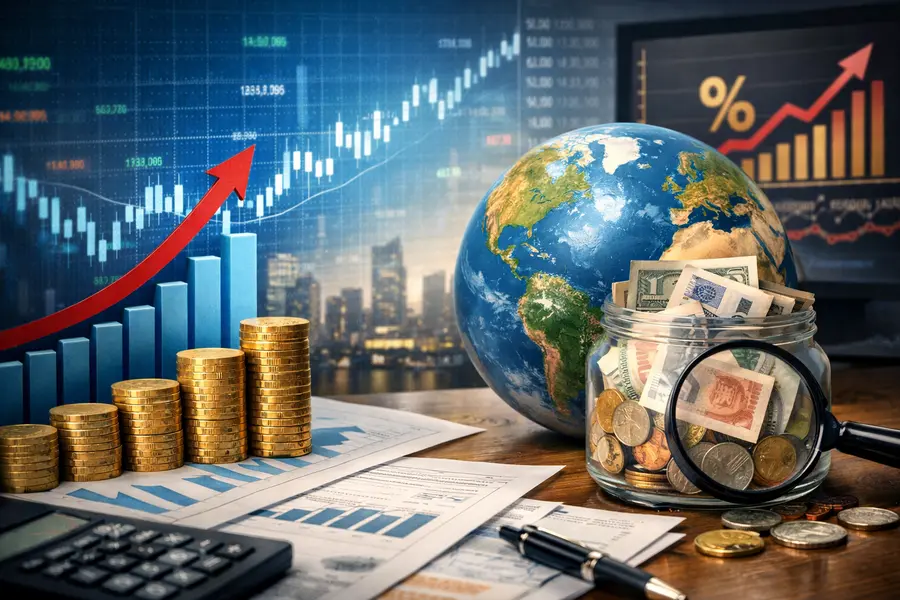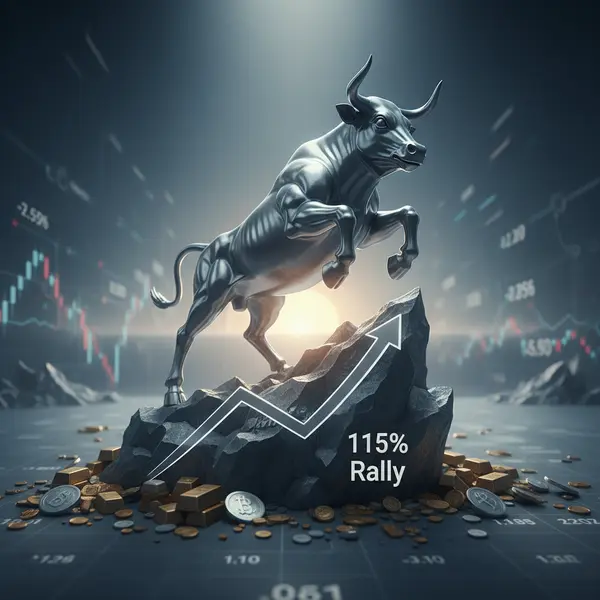
Silver at $75/oz in June 2026, up 115% year-on-year, as supply deficits and soaring industrial demand from solar and EVs extend the precious metals bull run.
- Silver traded at $74.74/oz on June 3, 2026, up over 115% year-on-year after setting an all-time record of $121.64 on January 29.
- The Silver Institute projects a 67-million-ounce supply deficit for 2026, the sixth consecutive year of structural undersupply.
- J.P. Morgan forecasts an $81/oz full-year average; Commerzbank targets $90 per ounce by December.
Lead
Silver traded at $74.74 per troy ounce on June 3, 2026 — a gain of more than 115% against the same date one year prior, when the metal changed hands near $34.76 — as chronic supply shortfalls, surging industrial absorption, and macroeconomic uncertainty sustain one of the precious metals complex's strongest silver bull cycles in two generations. The metal touched an all-time record of $121.64 on January 29 before retracing, and broad institutional consensus holds that the structural drivers underpinning the silver rally remain intact through year-end.What Happened
Silver has outperformed virtually every major asset class over the past twelve months. The metal opened 2026 above $100 for the first time in history, a milestone achieved in late January as speculative positioning, tightening London vault inventories, and a softening dollar combined to push prices to $121.64. Since that record, silver has consolidated in a $70–$80 range, with the June pullback attributed to steady Federal Reserve messaging that rules out near-term rate cuts.
Year-on-year, the move from $34.76 to $74.74 represents a 115% silver rally — the metal's strongest comparative annual performance since 1979, building on a roughly 147% advance recorded across full-year 2025.
Supply in Deficit for a Sixth Year
The Silver Institute projects the market will run a 67-million-ounce deficit in 2026, its sixth consecutive annual shortfall. Global mine output is forecast to rise just 1% to 820 million ounces, and while recycling is set to exceed 200 million ounces for the first time since 2012 — up 7% — total supply of 1.05 billion ounces falls short of aggregate demand.
Because more than 70% of silver is extracted as a byproduct of copper, lead, and zinc operations, expanding dedicated silver capacity requires years of development. No large mine projects are near completion that would materially alter the supply picture before 2028, meaning the structural deficit persists regardless of demand fluctuations.
The Industrial Demand Engine
Unlike gold, silver derives more than half its consumption from industrial applications — a characteristic that anchors demand to the global energy transition. Solar photovoltaic manufacturing alone consumed approximately 232 million ounces in 2024, representing roughly 19% of total annual demand and 34% of all industrial silver use, and renewable energy capacity additions globally show no sign of decelerating.
Electric vehicles represent a second structural tailwind. EVs require significantly more silver per unit than internal-combustion equivalents, and accelerating global EV penetration continues to add incremental tonnage to automotive demand. Physical investment demand is also climbing sharply: the Silver Institute forecasts a 20% increase to 227 million ounces in 2026, a three-year high, even as jewelry and silverware fabrication decline amid elevated price levels.Monetary Policy and Geopolitical Drivers
Federal Reserve policy remains the single most consequential macro variable. The central bank held rates steady twice in 2026, with persistent inflation concerns erasing earlier expectations for mid-year easing. The Fed leadership transition following Chair Jerome Powell's May term expiration adds a layer of uncertainty: a more dovish successor would likely reignite the debasement trade that lifted precious metals sharply in 2025, while a hawkish appointment could cap near-term upside by keeping real yields elevated.
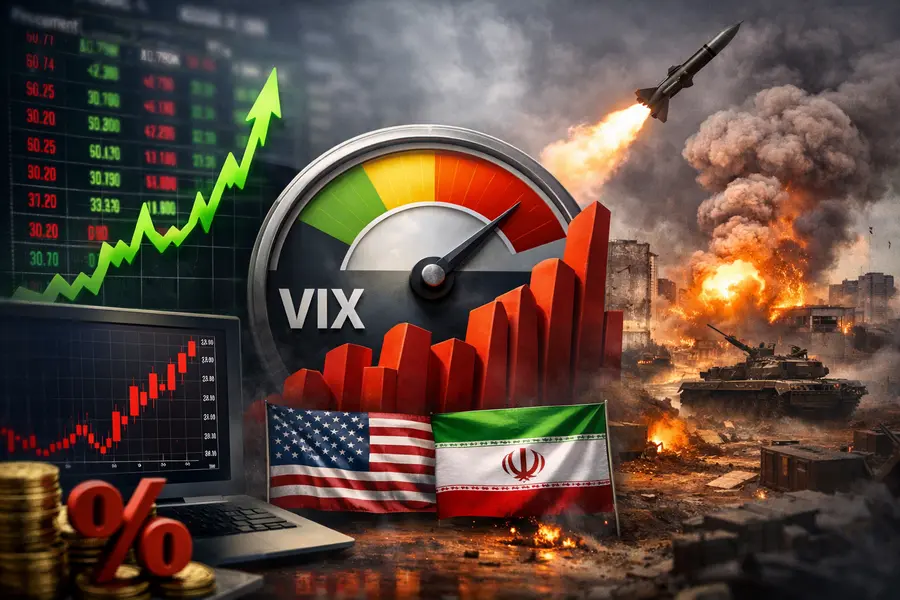
Geopolitical friction provides additional support. Deadlocked US-Iran peace negotiations, widening G7 fiscal deficits, and central bank reserve diversification away from dollar-denominated assets all underpin the broader precious metals complex. Tight physical inventory in London further amplifies price sensitivity to geopolitical shocks and short-covering episodes.
Market Reaction: Ratio and Capital Flows
The gold-to-silver ratio fell below 50 in early 2026 — a level last reached in 2012 — before recovering toward 55 as silver retraced from its January record. The compression from above 100 at its prior extreme signals a meaningful institutional rotation into silver relative to gold, reflecting both historical catch-up dynamics and silver's rising industrial credibility.
Exchange-traded vehicles have absorbed considerable capital. The iShares Silver Trust and the Sprott Physical Silver Trust recorded net inflows throughout 2026 as institutional allocators position alongside the structural deficit narrative. Silver mining equities, including mid-tier producers and royalty-focused operators, have broadly outperformed the underlying metal on a year-to-date basis.
Outlook
Silver enters the second half of 2026 with its fundamental underpinnings unchanged: a sixth consecutive year of structural deficit, accelerating green-energy demand, constrained new mine supply, and a macroeconomic backdrop that continues to favor hard assets over financial instruments exposed to fiscal and monetary risk.J.P. Morgan forecasts a full-year average of $81 per ounce; Commerzbank targets $90 by December, with $95 by end-2027. ING projects an $83 average for 2026, and UBS holds an $85 target through the third quarter. The metal's current consolidation in the $70–$80 band reflects a digestion of the January record run rather than a reversal of the underlying silver bull trend. Federal Reserve policy clarity and the trajectory of global solar capacity additions are the two variables most likely to determine whether silver retests its all-time high before year-end.
Mentioned tickers: SLV, PSLV, WPM, PAAS, AG Markets