Pomegra
Silver spot jumped 5.01% on Friday, its largest single-session advance in six weeks, as a shock U.S. payrolls miss compressed the gold-silver ratio and intensified the ongoing short squeeze narrative for the white metal.
- Silver posted a 5.01% single-day gain, outpacing gold by nearly threefold and narrowing the gold-silver ratio to approximately 67 — its tightest in six weeks.
- July nonfarm payrolls contracted by 23,000, the first outright monthly decline in months, against an 80,000-gain consensus, driving dollar weakness and metals demand.
- A sixth consecutive year of supply deficit — projected at 46.3 million ounces in 2026 — provides structural support beneath the short-term momentum.
Lead
Silver spot climbed to $64.69 an ounce on August 8, 2026 — a six-week high — after the U.S. Bureau of Labor Statistics reported that nonfarm payrolls fell by 23,000 in July, the first outright monthly contraction in several quarters and a sharp miss against the 80,000-gain consensus. Gold gained roughly 1.7% on the day, leaving silver's advance at nearly three times the yellow metal's pace. The gold-silver ratio narrowed from approximately 69 to around 67 — its tightest reading since mid-June — as silver added $3.09 per ounce on above-average volume.
What Happened
The Labor Department's payrolls miss was the session's defining catalyst. The report dragged the U.S. dollar to a two-week low and forced traders to rapidly unwind Federal Reserve rate-hike expectations, channeling capital into metals across the board. Gold, with its narrower use-case as a monetary store of value, responded with measured gains. Silver, carrying both precious-metal and industrial demand characteristics, responded with amplified force.
Gold settled near $4,350, up approximately 1.7%. The gold-silver ratio — which peaked at a historically extreme 105 in April 2025 before a sustained compression — now stands at 67, well below the post-2000 average of roughly 69 and approaching levels not seen since before the metal's multi-year lagging phase.
The Gold-Silver Ratio in Focus
The gold-silver ratio has been one of the defining measures of the current commodity cycle. A ratio of 105 in April 2025 signaled extreme relative undervaluation for silver on historical standards; the subsequent compression to 67 represents one of the sharpest ratio moves since the 2020 pandemic reset. At current levels, the ratio sits in contested territory: structural demand arguments leave room for further tightening toward the 60 area last seen in early 2026, while mean-reversion skeptics flag the pace of compression as technically stretched. The jobs report cleared at least one near-term uncertainty, providing fresh directional momentum.
Industrial Demand: The Structural Floor
Beneath Friday's macro-driven spike lies a more durable argument. Industrial demand for silver has entered a period of structural recalibration. Solar photovoltaic manufacturers — historically the single largest source of industrial consumption — aggressively thrifted silver from panel production in response to elevated input costs, cutting silver intensity by approximately 19% in 2026 and reducing PV-related demand to roughly 151 million ounces annually.
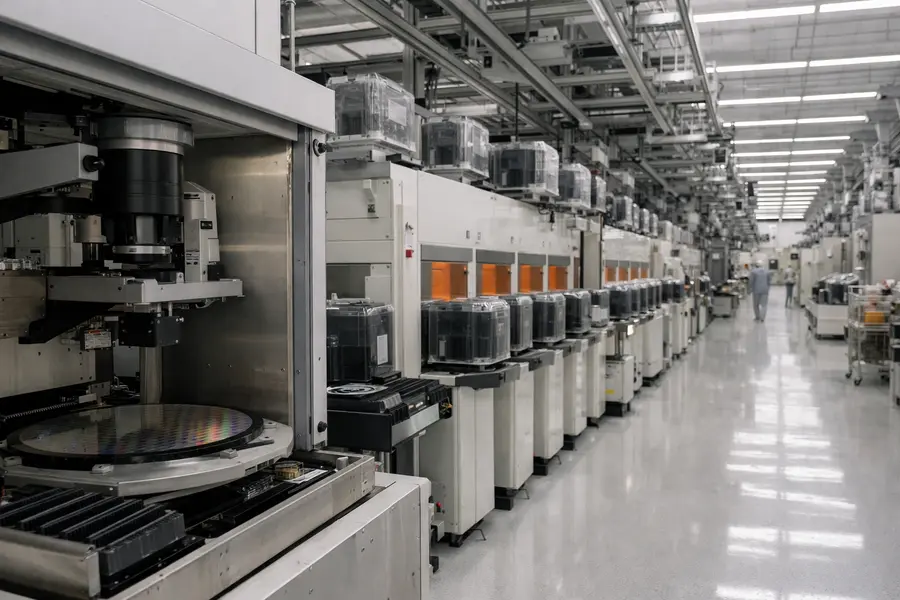
The sectors absorbing that displaced demand are growing in both volume and strategic importance. Electric vehicles, grid infrastructure, and — most prominently — artificial intelligence data centers now constitute incremental pillars of industrial demand. AI-linked hardware, including high-frequency computing interconnects, advanced power management systems, and high-density server architectures, relies on silver's superior electrical conductivity and thermal management properties. Total industrial fabrication is projected at approximately 650 million ounces in 2026, the sixth consecutive year in which end-use consumption has outrun primary mine supply and above-ground inventory replenishment.
The Squeeze Dimension
Friday's session bore the hallmarks of a squeeze event layered onto genuine macro repricing. The silver futures market has carried a notable institutional net short position from players positioned for mean reversion from 2025's highs. The payrolls shock triggered rapid position covering, amplifying the directional move beyond what macro fundamentals alone would imply.
The global silver market is projected to record a 46.3 million ounce supply deficit in 2026, widening from 40.3 million ounces in 2025 and representing the sixth consecutive year of shortfall. Approximately 762 million ounces have been drawn from above-ground stocks since 2021 — a structural drain that leaves the market increasingly exposed to squeeze episodes when external catalysts force institutional position unwinds. Additional supply constraints compound the picture: China, the world's dominant silver refining hub, implemented export restrictions effective January 2026, limiting the global market's ability to redirect refined material in response to price signals. Basel III capital requirements have simultaneously pushed European banks to reduce unallocated paper silver positions, adding physical demand pressure to an already strained market.
Outlook
The payrolls shock provided the immediate trigger, but the conditions reinforcing Friday's six-week high are not one-session phenomena. Structural supply deficits of increasing magnitude, a gold-silver ratio compressing from historically extreme levels, persistent industrial demand from AI and electrification infrastructure, and an institutional short base vulnerable to further covering all point to continued tension beneath the metal's near-term volatility. The next Federal Reserve meeting and incoming inflation data will serve as the primary tests of whether Friday's move marks the resumption of silver's broader bull run or a technically overextended advance subject to consolidation.
Mentioned tickers: SLV, GLD, PSLV, SILJ