Pomegra
undefined
- VTI attracted $34.87B in year-to-date 2026 inflows while QQQ posted $2.72B in net outflows over the same period.
- The Nasdaq fell 4.18% on June 4, 2026 — its worst single session since April 2025 — erasing roughly $1.3 trillion in chip-sector market cap.
- VTI's 0.03% expense ratio and exposure to roughly 3,600 U.S. equities make it a default diversification vehicle in concentrated-sector stress episodes.
Vanguard's VTI has pulled $34.9 billion in year-to-date 2026 inflows as tech sector volatility and Nasdaq selloffs drive institutional and retail investors alike toward broad market diversification.
---
Lead
The Vanguard Total Stock Market ETF (VTI) has become the defining capital-flow story of mid-2026. With year-to-date net inflows of $34.87 billion and total assets closing in on $625 billion, the fund has absorbed capital at a pace that contrasts sharply with the turbulence gripping technology-heavy benchmarks. A single five-day stretch in May saw $852 million enter the fund even as share prices dipped — a signal that investors are deliberately using volatility as an entry point into broad market diversification rather than retreating to cash.
---
What Happened
VTI inflows have accelerated in direct correlation with episodes of tech sector volatility news that have punctuated the first half of 2026. On June 4, the Nasdaq Composite dropped 4.18% to close at 25,709 — its steepest single-session decline since April 2025 — as U.S. semiconductor names shed a combined $1.3 trillion in market capitalization in one trading day. A follow-on decline in mid-July pushed the Nasdaq down a further 1.4% to 25,520.
Each of these dislocations triggered measurable rotation. In May alone, VTI recorded a single-period creation surge exceeding $5.5 billion, with ETF channel data confirming heightened institutional basket activity. The fund's year-to-date inflow of $34.87 billion compares to a $2.72 billion net outflow from QQQ, the Invesco Nasdaq-100 ETF, over the same window — a divergence that underscores the directional shift in how large allocators are positioning U.S. equity exposure.
---
The Diversification Premium
The capital preference for VTI over QQQ is not a performance chase. QQQ has outpaced VTI on a total-return basis in 2026, gaining 15.12% year-to-date against VTI's 10.68%. Over a ten-year horizon, the gap is wider still: QQQ has compounded at roughly 20.94% annually versus VTI's 14.58%.
The flow data nonetheless runs in VTI's favor because investors are explicitly paying a diversification premium — accepting lower headline returns in exchange for reduced concentration risk. VTI's portfolio spans approximately 3,600 U.S.-listed equities across all market capitalizations, compared to QQQ's 100-stock universe with heavy weighting to a handful of mega-cap technology names. With the top seven technology companies — Microsoft, Nvidia, Apple, Alphabet, Amazon, Meta, and Tesla — accounting for a disproportionate share of index-level returns in recent years, the argument for rebalancing into a wider mandate has gained institutional traction.
VTI's 0.03% annual expense ratio, among the lowest in the ETF industry, removes cost as a barrier to the switch. For large pension funds and endowments recalibrating risk frameworks, the economics of the trade are straightforward.
---
Technology Sector Stress Points
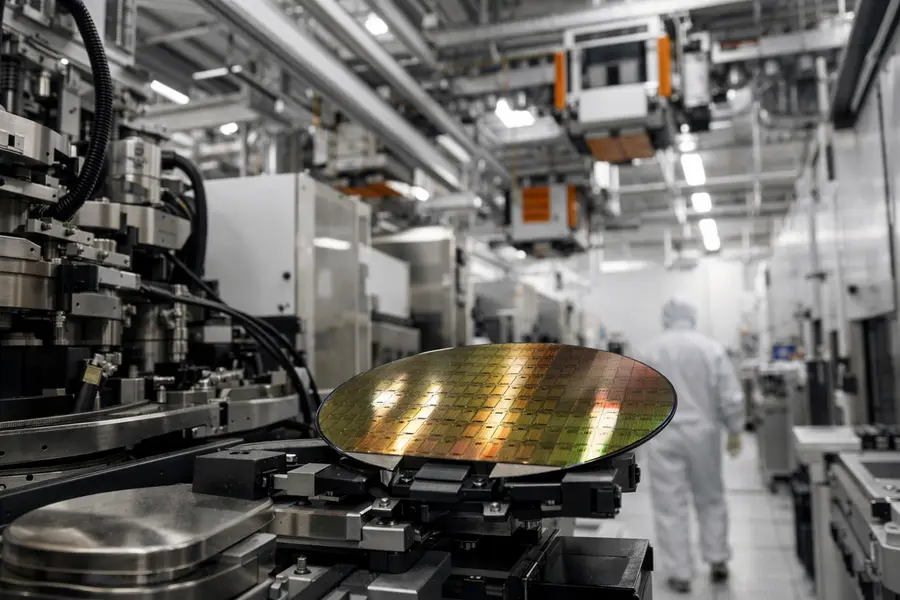
The semiconductor sector has been the primary source of tech sector volatility in 2026. Export control measures targeting advanced chip architectures, combined with inventory correction cycles at several leading foundries, have produced sharp intraday moves in names that carry outsized weight in technology-focused benchmarks. The June 4 episode — the worst Nasdaq session in over a year — was concentrated in chipmakers, illustrating how policy and supply-chain uncertainty can compress valuation multiples across the sector simultaneously.
This dynamic makes technology-heavy vehicles vulnerable to correlated drawdowns in ways that broad market diversification is designed to buffer. When a single sector accounts for 30% or more of a benchmark's weight, sector-specific shock transmits directly to index-level performance. Funds like VTI, which distribute exposure across technology, financials, healthcare, industrials, consumer discretionary, and energy, absorb such shocks more gradually.
The broader ETF market is responding accordingly. Total ETF inflows across all categories are projected to reach $2.3 trillion in 2026, up from $1.5 trillion in 2025, with broad-market equity and fixed-income funds capturing a disproportionate share of new assets. Vanguard has surpassed BlackRock's iShares division as the largest ETF provider by assets under management — a structural shift that reflects the scale of flows into low-cost, diversified vehicles.
---
Strategic Context
The rotation toward VTI reflects a broader recalibration in portfolio construction philosophy. In the period between 2020 and 2024, concentrated technology exposure generated outsized returns that reinforced momentum-driven allocation. As that cycle has matured and valuations at the top of the market capitalization distribution have risen, risk-adjusted return calculations have shifted.
Smaller and mid-capitalization equities, which are meaningfully represented within VTI's 3,600-stock universe but largely excluded from the Nasdaq-100, have attracted renewed analytical attention. Their valuations, relative to historical norms and to mega-cap peers, present a different risk profile. Within a Vanguard VTI ETF structure, exposure to these segments comes without requiring active management or a separate fund allocation.
The long-term asset growth figures for VTI support the structural nature of this demand: the fund has added $412.67 billion in net assets over five years and $606.87 billion over ten years, suggesting that the current inflow cycle is an acceleration of a durable trend rather than a tactical rotation.
---
Outlook
VTI inflows show no sign of reversing as long as tech sector volatility remains elevated and concentration concerns persist in large-cap technology benchmarks. The fund's year-to-date net addition of $34.87 billion, its proximity to $625 billion in total assets, and the simultaneous outflows from QQQ collectively suggest a durable shift in how institutional capital is approaching U.S. equity allocation in 2026. With the broader ETF market on pace for record annual inflows and Vanguard holding its position as the industry's largest provider, the structural case for broad market diversification continues to attract assets even when — and especially when — narrow-sector momentum falters.---
Mentioned tickers: VTI, QQQ, MSFT, NVDA, AAPL, GOOGL, AMZN, META, TSLA