Pomegra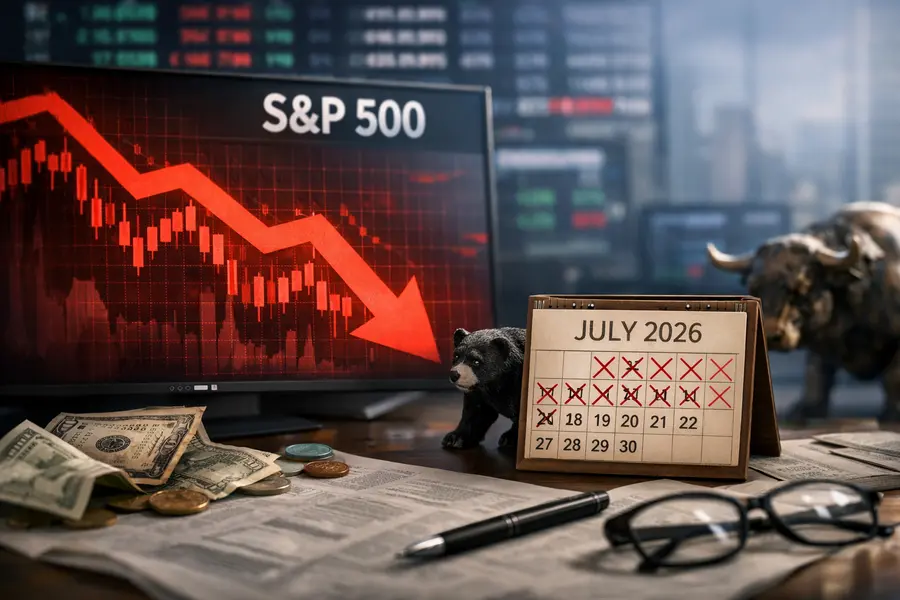
S&P 500 closed July 2026 with a -0.12% loss, ending an 11-year winning streak as mega-cap AI and chip stocks dragged the calendar july market lower.
- The S&P 500 posted its first negative July since 2014, closing at 7,489.72 on July 31 after recovering 0.7% on the final session.
- Mega-cap technology stocks shed $658 billion in combined market value; the semiconductor ETF SOXX fell 22.1%, its worst month since December 2002.
- Despite the headline loss, 59% of S&P 500 constituents rose in July, with the equal-weight index outperforming its cap-weighted counterpart.
Lead
The S&P 500 ended July 2026 with a -0.12% decline — marginal in isolation, but historically significant. It marks the first time since July 2014 that the index finished a calendar month in negative territory, ending eleven consecutive positive Julys spanning 2015 through 2025. The index closed at 7,489.72 on July 31, recovering from 7,437.63 the prior session after a 0.7% final-day rally that softened but did not erase the month's loss.
What Happened
Information Technology, which carries approximately 36% of the S&P 500's market-cap weight, bore the brunt of a concentrated selloff in artificial intelligence infrastructure names. The iShares Semiconductor ETF (SOXX) fell 22.1% in July — its steepest monthly decline since December 2002 — even after a 9% surge across the final two sessions recovered some ground. Micron Technology (MU) shed 28.7% for the month, joining memory-chip peers as the correction's most acute casualties. The broader technology sector ETF lost roughly 8%.Three converging pressures drove the reversal: investor skepticism about near-term returns on AI capital expenditure, rising Treasury yields that compressed multiples on high-duration growth stocks, and elevated crude prices fueled by Middle East supply tensions.
Inside the Decline: Tech's Outsized Weight
The sp500 chart for July 2026 demonstrates how market-cap weighting can distort headline readings. Information Technology and Communication Services led the month's laggards, together pulling the cap-weighted index into negative territory despite broad gains elsewhere.
Not all technology moved lower. Microsoft (MSFT) surged 24.6% after reporting a strong quarterly earnings beat, and Amazon (AMZN) rallied on the final session. The iShares Expanded Tech-Software Sector ETF gained 4.4%, underscoring a clear bifurcation: hardware and chip names absorbed the shock while software businesses with durable recurring revenue streams moved higher. Hyperscalers — including Meta Platforms (META) and Alphabet (GOOGL) — reaffirmed heavy AI infrastructure spending plans during earnings calls, yet the market increasingly questioned the pace of outlay relative to visible near-term returns.
Market Breadth Tells a Different Story
Beneath the headline figure, the calendar july market data pointed to a structurally healthier backdrop than the index return implied. Approximately 59% of S&P 500 constituents posted gains during the month. The S&P 500 Equal-Weight Index outperformed its cap-weighted counterpart, and key breadth indicators — including the advance-decline line and the proportion of stocks above their 200-day moving average — improved relative to June. The loss was, in effect, a story of a small subset of very large stocks, not of broad market deterioration.
Sector Rotation and Macro Backdrop
Energy (XLE) was July's standout, lifted by elevated crude prices tied to geopolitical risk in the Middle East. Financials, Health Care, and Real Estate all closed the month in positive territory, drawing rotation out of crowded AI-linked positions. Six of the eleven S&P 500 sector ETFs finished July in the green.The macro environment provided additional headwinds for growth valuations. Treasury yields remained elevated throughout the month, applying steady pressure to high-multiple names even as corporate earnings for the second quarter came in largely above consensus across cyclical sectors. The rotation from semiconductor hardware toward software, financials, and energy-adjacent names accelerated through the second half of July, suggesting institutional repositioning rather than a broad risk-off move.
Entering July, the S&P 500 carried approximately 9.6% in year-to-date price gains through the first half of 2026 — well above its long-run average. The index's historical July return has averaged 3.2% annually since 2015, a tailwind that failed to materialize this year as concentration risk overrode seasonal patterns.
Outlook
July 2026's decline interrupts a sustained winning streak without reversing the year's upward trajectory. With year-to-date gains intact and market breadth widening, the rotation from concentrated mega-cap leadership toward a broader set of sectors may prove constructive heading into the second half. The pivotal question for August is whether the semiconductor and AI-hardware selloff represents a valuation reset within an ongoing investment cycle — or the beginning of a more sustained de-rating. Federal Reserve policy signals and capital expenditure updates from major hyperscalers will be the primary variables to watch as the market navigates the transition.
Mentioned tickers: SPY, SOXX, MU, MSFT, AMZN, META, GOOGL, XLE