Pomegra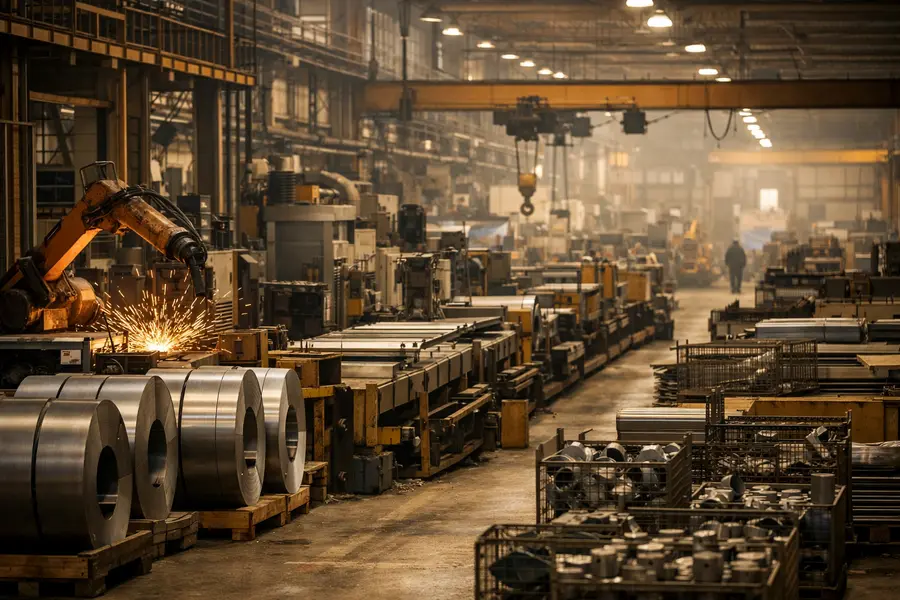
The Federal Reserve's August industrial production report lands Friday at 9:15 a.m. ET, the first hard factory gauge after a 25bp hike lifted interest rates to a 2007 high.
- The Fed raised rates 25bp to 3.75%-4.00% on Sept. 16 - the first hike in three years - with a second increase flagged for later in 2026.
- July IP grew just 0.2%, with capacity utilization at 76.3%; the 10-year Treasury yield has since crossed 5%, its highest level since 2007.
- The ISM manufacturing PMI held at 54.6 in August, an eighth straight month of expansion, though new orders cooled 3.0 points to 53.7.
Lead
The Federal Reserve's G.17 Industrial Production and Capacity Utilization report for August 2026 prints Friday at 9:15 a.m. ET, arriving two trading sessions after the first interest rate increase since 2023 carried the federal funds rate to a 3.75%-4.00% target range. With 10-year Treasury yields closing at 5.01% in the wake of the decision - the highest since 2007 - the August G.17 becomes the first definitive hard-data answer to the question shadowing manufacturing all year: whether the factory floor is beginning to crack under the steepest borrowing costs in nearly two decades.
What Is the Market Watching in Friday's G.17?
Consensus is focused on whether manufacturing output has begun to buckle under elevated financing costs and tighter credit conditions. July's industrial production reading of 0.2% - matching the manufacturing sub-index month on month - was uninspiring but not alarming, leaving capacity utilization at 76.3%, already 3.1 percentage points below its 1972-2025 long-run average. A second successive soft print would intensify debate over how quickly higher interest rates are transmitting into the real economy. Capacity utilization is a secondary focal point; any further softening would signal idle factory capacity is accumulating, a traditional precursor to capital expenditure pullbacks.
The Rate Context: Why Interest Rates Are the Central Variable
The September 16 rate decision lifted borrowing costs to terrain that, measured against prime rate history, has not been crossed since the housing-cycle peak of 2007. The 10-year Treasury yield, which closed at approximately 5.01% after the decision, compresses capital budgets, raises hurdle rates for new equipment investment, and inflates the cost of revolving credit lines carried by small and mid-size manufacturers. The Federal Reserve's updated dot plot signaled that most FOMC members anticipate at least one additional hike before year-end, meaning financing pressure on factory balance sheets is unlikely to lift in the near term.
What Does Survey Data Suggest Ahead of the Hard Number?
The August ISM Manufacturing PMI at 54.6 - an eighth consecutive month above 50 - provides a constructive baseline. The ISM associates a reading of that level with roughly 2.4% annualized real GDP growth. The production sub-index retreated only 0.2 points to 58.3, implying factory floors remained broadly active through the reference month. The forward-facing components softened noticeably, however: new orders fell 3.0 points to 53.7, backlogs declined 3.2 points to 51.8, and the employment index cooled to 51.2 from 52.8. These leading indicators typically precede headline industrial production movements by one to two months, which is why the August G.17 will be read against them with unusual scrutiny.
Structural Demand Offsetting Rate Drag
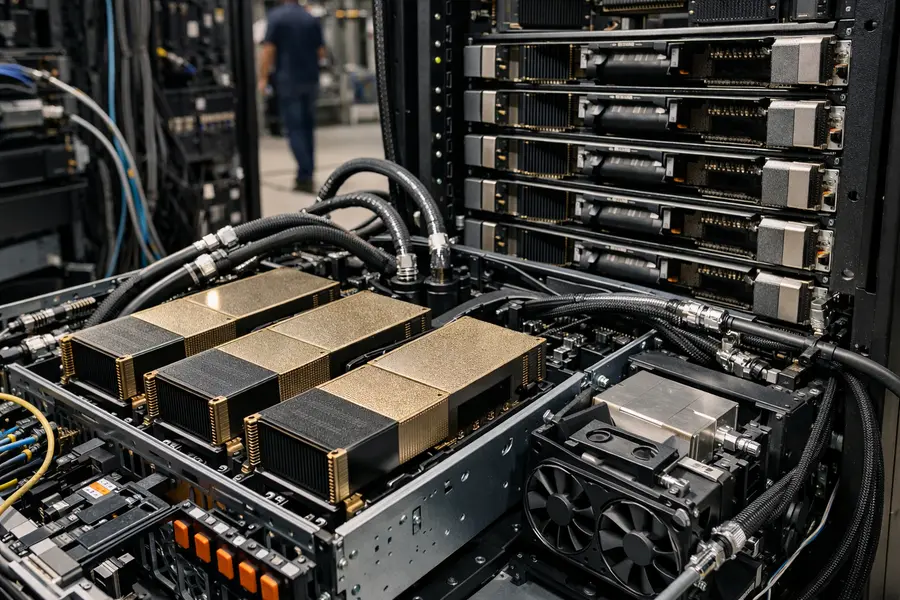
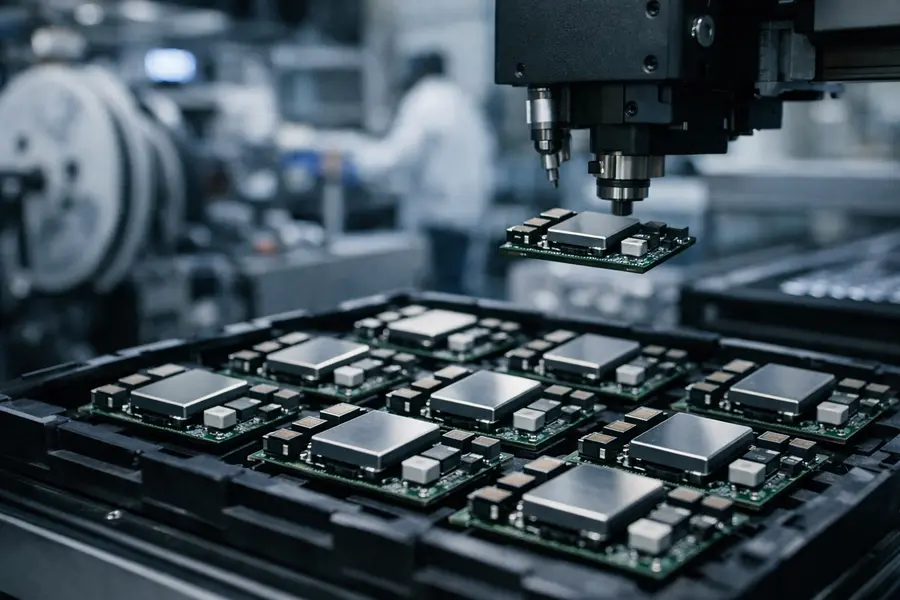
Multiple demand streams are insulating manufacturing from the full force of the rate shock. The artificial intelligence infrastructure buildout has sustained demand for semiconductors, advanced fabricated components, and electrical equipment - sectors where NVDA-driven server investment ripples across domestic supply chains tracked by indices such as SMH. Manufacturing technology orders reached record levels in 2026, and industrial 3D printer shipments expanded 18% in the first quarter. Separately, reshoring momentum driven by tariff policy and supply-chain diversification continues to generate committed greenfield factory investment that is largely rate-insensitive in the near term.
Why Did the Fed Hike Despite Tepid Manufacturing Prints?
The decision was driven by inflation data rather than output data. August's Producer Price Index showed pipeline price pressures had not fully subsided, leaving the committee without the confidence to pause. The dot plot's forecast of at least one additional increase underscores that the Fed is conditioning policy on price stability rather than manufacturing momentum - a stance that places Friday's G.17 at the intersection of two competing forces: a still-resilient industrial base and a central bank committed to higher interest rates for longer.
Outlook
Friday's August G.17 will calibrate the policy debate heading into the Fed's next meeting. An IP reading materially above July's 0.2% would reinforce the case for the projected additional hike and ease concern that rate sensitivity is spreading through factory operations. A second successive soft print, or an outright contraction, would sharpen scrutiny of whether the highest borrowing costs since 2007 are converting survey-level softness into measurable production declines. Broad equity benchmarks tracked by SPY and QQQ are positioned to react sharply to either outcome, given the data's direct bearing on how much further the Fed can tighten before manufacturing stress becomes explicit in the hard-data record.
Mentioned tickers: SPY, QQQ, NVDA, SMH