Jeremy Grantham warned on June 26 that AI-driven U.S. market valuations are the most extreme in history, with tariffs amplifying a potential 70% peak-to-trough crash.
- Grantham told CNBC on June 26 that the Buffett Indicator stands at 235% of GDP, eclipsing the dot-com era peak.
- Hyperscalers are projected to spend $725 billion on AI infrastructure in 2026 with no clear path to profitability.
- Tariff threats on semiconductors compound AI investment risk and could accelerate a broader market correction.
Lead
Jeremy Grantham, co-founder of Boston-based asset manager GMO and one of the few investors to call both the 2000 dot-com peak and the 2007 housing collapse, appeared on CNBC's Squawk Box on June 26, 2026 to deliver his most forceful warning yet: the Jeremy Grantham AI bubble has fully materialized, U.S. equities now trade at their most extreme valuations in recorded financial history, and the tariff threat impact on the global semiconductor supply chain makes the current setup uniquely dangerous relative to any prior cycle.
"Based on the value of the stock market compared to GDP, with modifications, this is the most expensive market in American history," Grantham said. He placed the potential peak-to-trough decline at "closer to 70%" — larger than the 50% corrections seen in previous speculative episodes.
What Happened
The proximate trigger for Grantham's renewed alarm is the so-called Buffett Indicator — the ratio of total U.S. market capitalization to gross domestic product — which has reached 235%, representing a stock market more than twice the size of the underlying economy. Warren Buffett himself warned that readings approaching 200% were "playing with fire." That threshold was briefly touched in 1999 and 2021; today it has been surpassed by a margin that has no historical precedent.
The broader valuation backdrop reinforces the concern. The S&P 500's price-to-earnings ratio is estimated at 35 to 40 times earnings, matching or exceeding the 35x seen at the dot-com peak in March 2000. Grantham notes that P/E ratios have averaged more than 60% above their century-long historical norm since 2010 — a persistent gap he attributes in part to the prolonged era of near-zero interest rates that has now ended.
The AI Investment Risk
In a January 2026 GMO research paper titled Valuing AI: Extreme Bubble, New Golden Era, or Both, Grantham and his colleagues acknowledged that AI is a genuinely transformative technology — but argued that near-universal recognition of that fact has generated exactly the kind of dangerous overinvestment that has preceded every great speculative boom in history.
The numbers are stark. Amazon, Alphabet, Meta, and Microsoft collectively spent nearly $300 billion on capital expenditures in 2025, with AI infrastructure now accounting for an estimated 1.3% of U.S. GDP. For 2026, that figure is projected to climb to 1.6% of GDP, with total hyperscaler capex reaching approximately $725 billion. The cash flows needed to justify that spending have not materialized. Total AI-related revenue across the sector remains below $50 billion. OpenAI reported an estimated $8 billion operating loss on $12 billion of revenue in 2025, and its own internal projections call for losses to reach $17 billion in 2026 and $35 billion in 2027.
Grantham describes the hyperscalers as locked in a prisoner's dilemma: each company fears that restraint will cede decisive ground to a rival, all but guaranteeing collective overinvestment. "We have gone from a monopoly world to a brutal, competitive world," he said in a May 2026 interview. "There will be blood in the streets."
The pattern is not novel. GMO's analysis notes that railways, electricity, radio, and the internet each produced great bubbles followed by severe market corrections — even when the underlying technology ultimately proved transformative. All 26 prior two-sigma market bubbles in Grantham's historical dataset reverted to trend without exception.
Tariff Threat Impact
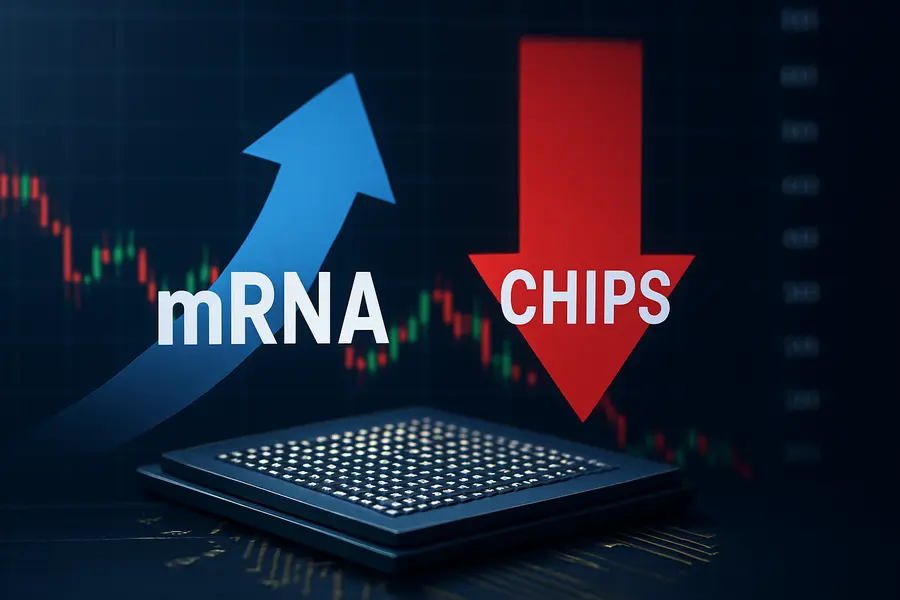
What distinguishes the stock market bubble 2026 from prior speculative episodes, in Grantham's framework, is a second, politically driven risk layer: trade policy. The Trump administration's sweeping tariff regime, introduced in early 2025, has generated meaningful supply-chain turbulence for the semiconductor ecosystem that underpins the entire AI buildout.
Nvidia and TSMC, the two companies most critical to delivering AI compute capacity, operate supply chains spanning Taiwan, South Korea, the Netherlands, and the United States. Tariffs on imported components inflate the cost of building the data centers driving the AI arms race. While semiconductors received a temporary carve-out from the broadest tariff schedules, the permanence of that exemption remains unresolved policy. A loss of the semiconductor exemption would add materially to infrastructure costs at the precise moment hyperscalers are already turning to debt markets to fund a buildout that has not yet generated positive cash flow. Morgan Stanley and JPMorgan have estimated the technology sector may need to issue $1.5 trillion in new debt over the next several years to finance the AI capital program.TSMC's advanced CoWoS packaging capacity is projected to reach 90,000 wafers per month by end-2026 — still insufficient to meet projected demand — a bottleneck that tariff-induced supply-chain friction could worsen further. For Grantham, tariffs represent a classic bubble-pricking catalyst: an exogenous shock that materializes when valuations leave no margin of safety.
Market Reaction
U.S. equity markets have continued their advance into mid-2026, with the S&P 500 setting successive records. That resilience is consistent with Grantham's historical framework: bubbles routinely persist — and often accelerate — longer than skeptics expect before reversing. He places the window for a significant correction anywhere from two weeks to two years, declining to narrow the timing further given the inherent unpredictability of late-cycle market dynamics.
Grantham recommends investors hold zero U.S. equities, allocate approximately 60% to broad non-U.S. equity indices, up to 10% to precious metals, and the remainder to investment-grade bonds yielding between 4.5% and 5%.
Outlook
The Jeremy Grantham AI bubble thesis rests on a convergence of conditions that, historically, have each preceded major dislocations: record-high valuations relative to GDP and earnings history, speculative overinvestment in a single transformational technology, a widening profitability gap that may take years to close, and an external policy shock in the form of tariffs. The structural imbalance Grantham identifies — $725 billion in annual AI infrastructure spending against sub-$50 billion in AI revenue — leaves the sector with limited tolerance for further multiple expansion. Whether a correction arrives at the near end or far end of his two-week-to-two-year window, the risk-reward calculus for U.S. growth equities has rarely looked this asymmetric.
Mentioned tickers: SPY, QQQ, NVDA, AMZN, GOOGL, META, MSFT, TSM, GLD