Pomegra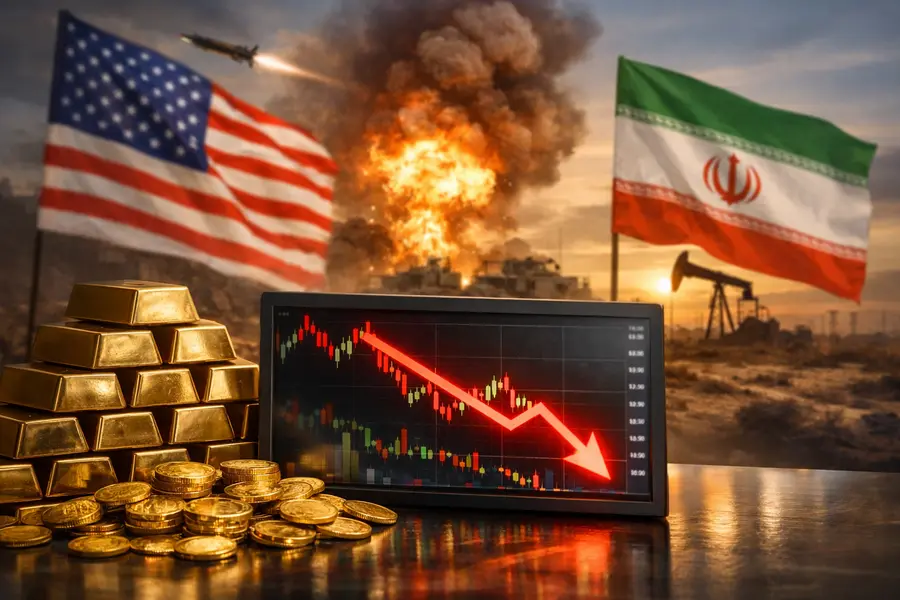
Gold spot prices slid to a nine-month low near $4,000 on July 16, as the U.S.–Iran peace framework drained the war risk premium from precious metals, rotating safe-haven capital into the dollar and yield-bearing Treasuries.
- Gold briefly broke below $4,000 to $3,992.02 on July 16, its weakest level since November 2025, down ~28% from January's record peak near $5,600
- Silver extended a seven-week losing streak to approximately $55.50 per ounce, with the gold/silver ratio widening to 70.8:1 — signaling broad pressure across the precious metals complex
- Combined gold and silver market capitalization shed roughly $700 billion in recent sessions as capital rotated toward yield-bearing assets
Lead
New York, July 16 — Gold slid to a nine-month low on Thursday, briefly breaking below $4,000 per ounce to $3,992.02 as the geopolitical risk premium accumulated during the U.S.–Iran conflict continued to drain from bullion. The gold price drop — now a cumulative decline of approximately 28% from the January 2026 record peak near $5,600 — reflects a broad market reassessment of safe haven asset performance following the June U.S.–Iran interim peace deal that reopened the Strait of Hormuz and formally ended the most acute phase of Persian Gulf hostilities.What Happened
Gold's Thursday move unfolded against competing forces. A softer-than-expected U.S. Consumer Price Index print on July 15 initially pushed spot prices back to $4,088 per ounce, briefly suggesting resilience. That gain evaporated within hours as the U.S. dollar strengthened in response to residual Middle East oil risk — a dynamic that penalized zero-income metals while rewarding currency holdings with yield.
By Thursday morning, gold had slipped to $3,992, its lowest settlement zone since November 2025. Silver fell 1.4% to approximately $55.50 per ounce, logging a seventh consecutive weekly decline and its lowest print in seven months. The gold/silver ratio widened to 70.8:1 — a level indicating that silver, historically more volatile, absorbed a disproportionate share of the selling. Platinum declined to $1,641 per ounce, down roughly 10% for the month, while palladium held at $1,310 per ounce.
The War Premium Unwinds
The structural driver behind gold's decline traces to the June 2026 diplomatic process. An interim U.S.–Iran peace framework reached on June 15–16 halted active hostilities, reopened the Strait of Hormuz, and pulled Brent crude from wartime highs to approximately $77–78 per barrel. That shift removed the primary justification for holding bullion at record prices: with oil falling and inflation expectations cooling, the Federal Reserve faced less pressure to raise rates — simultaneously weakening both the inflation-hedge and rate-hedge components of gold's premium.
The picture remained unsettled through early July. President Trump declared the ceasefire "over" at the NATO summit on July 8, pushing crude oil 6% higher and sending gold briefly back toward $4,072. Weekend airstrikes on July 12–13 introduced renewed uncertainty. On July 16, Iran threatened to close the Bab el-Mandeb Strait, a critical chokepoint for global shipping. Yet each escalation generated diminishing safe-haven flows into gold — a pattern that signals the most acute phase of war-driven demand has structurally passed.
A concrete de-escalation signal arrived July 16 when the Trump administration rescinded a threatened 20% tariff on Strait of Hormuz cargo, which markets interpreted as preserving the broader peace architecture even as individual tensions persisted.
Market Reaction and Safe-Haven Rotation
Gold's performance exposed a fundamental shift in safe-haven mechanics. Capital that flooded into precious metals during 2025 and early 2026 has rotated into the U.S. dollar and short-dated Treasuries, driven by yield arithmetic that gold cannot match: the Federal Reserve maintains its funds rate at 3.50%–3.75%, and the 10-year Treasury yield stands at 4.56%. Against those returns, a zero-income asset requires persistent fear to command a premium.
Bitcoin illustrated the contrast, holding near $64,650 through the same period and posting a weekly gain of approximately 4%. Traders attributed Bitcoin's relative resilience to its sensitivity to risk appetite rather than geopolitical panic — a distinct positioning dynamic compared with gold's traditional haven role.Central banks provided a notable structural offset. The People's Bank of China recorded its 20th consecutive month of gold accumulation in June, adding approximately 15 tonnes. Poland accumulated 82 tonnes in the first half of 2026. Sovereign demand has established a durable floor beneath bullion, but not one large enough to absorb the deleveraging of speculative long positions accumulated near the January peak.
Geopolitical Dimension
The conflict's arc illustrates how geopolitical risk is priced asymmetrically in commodity markets. Gold surged as the U.S.–Iran confrontation escalated, compressing years of potential appreciation into months. The unwinding of that premium, however, unfolds more slowly and unevenly. The $3,000 level — which marked gold's trajectory before the conflict premium began accumulating — now represents the critical long-run technical reference traders are monitoring. A sustained break below $4,000 would sharpen debate over whether the current correction represents a normalization toward pre-conflict valuations, or a structural reversal of the multi-year bull market in bullion.
Outlook
Gold enters the second half of July under pressure from converging forces: the war-premium unwind, dollar strength linked to elevated U.S. rate expectations, and a diminishing volatility response to Middle East headline risk. The Federal Reserve's next policy meeting and any material disruption to the U.S.–Iran peace framework remain the two variables most capable of reversing the current trend. Until one or both shifts decisively, the $4,000 threshold — and the path that opens toward the gold $3,000 level — defines the near-term range for precious metals.