Pomegra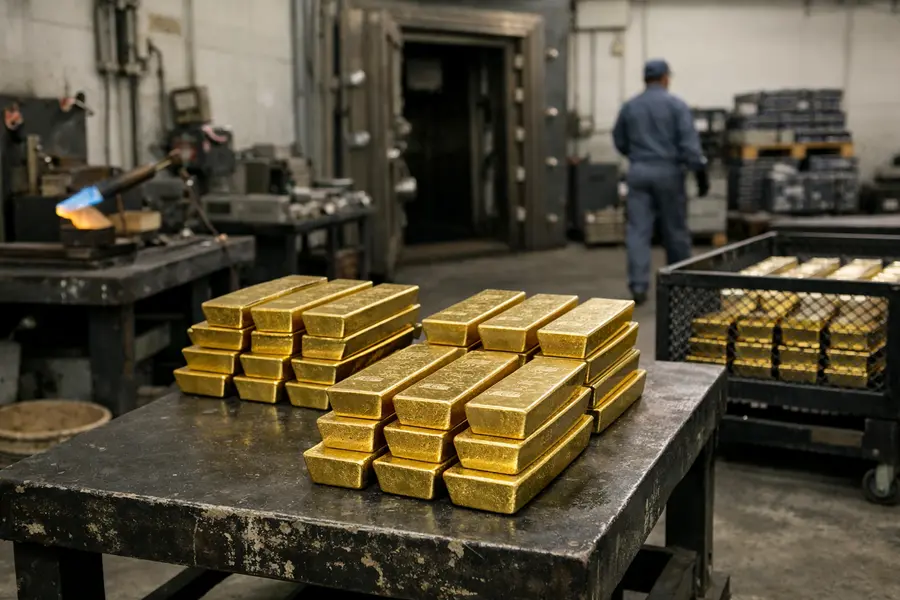
Spot gold hit $4,434 per ounce in August 2026 as GLD ETF inflows reached $8.3 billion and central banks extended 21 consecutive months of bullion buying.
- Gold gained 9% through August, with spot prices reaching $4,434 per ounce - a two-month high - as cooling U.S. CPI data shifted Federal Reserve rate expectations lower.
- SPDR Gold Shares (GLD) absorbed $8.3 billion in net inflows, pushing the fund's total assets under management above $137 billion.
- China's central bank extended its gold accumulation to 21 consecutive months, lifting official reserves to 76.08 million ounces as of end-July.
Lead
Gold staged its sharpest August rally in recent memory, climbing 9% to reach $4,434 per ounce - the metal's highest level in over two months - as institutions rotated back into physical gold bars and exchange-traded funds following a war-driven selloff that had erased more than 20% from peak levels earlier in 2026. December gold futures opened at $4,446.90 per troy ounce on August 11, with spot prices holding above $4,380 through the latter portion of the month. The recovery marks a significant reversal from the lows triggered by the U.S.-Iran conflict, which initially redirected institutional risk appetite away from safe-haven assets as surging crude oil prices raised the prospect of a prolonged Federal Reserve tightening cycle.
Why Did Gold Reverse Course in August?
Cooling U.S. consumer price index data for July was the immediate catalyst, shifting market expectations sharply away from additional rate increases and toward the possibility of a cut later in 2026. Real yield expectations declined alongside the shift, and the dollar softened - two conditions that historically compress the opportunity cost of holding precious metals. Alongside the macro pivot, the U.S.-Iran conflict - which had pushed crude to $119 per barrel at its peak - transitioned from a headwind to a tailwind. With diplomatic negotiations effectively collapsed following Trump's public declaration that a deal was "over," the prospect of a near-term de-escalation faded, and institutional safe-haven demand reasserted itself. Physical demand combined with paper exposure have together supported a sustained move above the 200-day moving average near $4,340.
Central Banks Anchor Physical Demand
Sovereign accumulation supplied the structural foundation for the rally. Physical demand - central-bank purchases combined with private bullion vault accumulation - accounted for approximately 55% of the August price move, with ETF and futures positioning supplying the remaining 45%. The People's Bank of China has now added gold to its reserves for 21 consecutive months, with official holdings reaching 76.08 million ounces as of end-July - an increase of 640,000 ounces from June and the largest quarterly addition since 2020 for any quarter during that streak. The bank added approximately 20 tons in July alone. Poland's National Bank leads all sovereign buyers in 2026 with roughly 82 tonnes accumulated year-to-date, followed by China with approximately 40 tonnes. South Korea resumed gold purchases for the first time in 13 years, while Turkey, Brazil, and Saudi Arabia collectively contributed an additional 70 tons to global official reserves during the period.
What Does ETF and BullionVault Flow Data Show?
Institutional demand is traceable across both paper and physical channels. GLD - the world's largest gold ETF with $137.1 billion in assets under management - held 32.4 million ounces in trust, divided between JPMorgan (30 million ounces) and HSBC (HSBC, 2.4 million ounces). Net inflows into GLD reached $8.3 billion through August, reflecting a broad rotation by pension funds and other large allocators treating the fund as an inflation hedge and safe-haven proxy. Global gold ETF holdings increased by 24 tons between July 20 and mid-August - the fastest rate of accumulation since April - lifting total global ETF assets in the gold segment to $530 billion. BullionVault premium signals in Asian trading hubs confirmed the institutional-scale buying of large-format gold bars at the wholesale level, reinforcing the flow data from listed vehicles.
Market Structure and Resistance
Having cleared the 200-day moving average near $4,340, spot gold now faces the 50-day moving average at approximately $4,730 as the next significant technical hurdle. That level corresponds to the upper boundary of the pre-war trading range and represents roughly 7% upside from current prices. A sustained break above it would require either a more decisive dovish signal from the Federal Reserve or a material intensification of geopolitical risk premiums from the Middle East. The metal remains caught between a structural bull case built on sovereign demand and a policy ceiling imposed by energy-driven inflation uncertainty.
How Do Analysts Assess Gold's Year-End Trajectory?
Price targets diverge widely. J.P. Morgan holds the highest published year-end 2026 forecast at $6,300 per ounce, anchored by expectations of sustained central bank demand, continued ETF inflows, and a structurally weaker dollar. HSBC revised its 2026 average gold price forecast to $4,560 following the war-driven disruption, citing uncertainty around the Federal Reserve's response to oil-linked inflation. The metal faces a binary setup into year-end: a Federal Reserve pivot driven by decelerating inflation would remove the principal ceiling on the rally, while any energy-driven tightening cycle or diplomatic breakthrough in the Iran conflict risks a renewed reversal of the safe-haven positioning built through August.
Outlook
Gold's 9% August recovery has reasserted the metal's role as an institutional hedge in a portfolio environment defined by geopolitical instability and shifting rate expectations. Sovereign demand - 21 months of uninterrupted Chinese central bank accumulation, Poland's 82-tonne year-to-date program, and South Korea's return to the market - provides a structural floor beneath current price levels. GLD inflows and physical-market premium data confirm that institutional conviction is broadening beyond futures markets into physical gold bars and wholesale bullion channels. The Federal Reserve's response to incoming CPI and labor market data will be the primary near-term variable determining whether gold consolidates above $4,400 or advances toward the $4,730 resistance level.