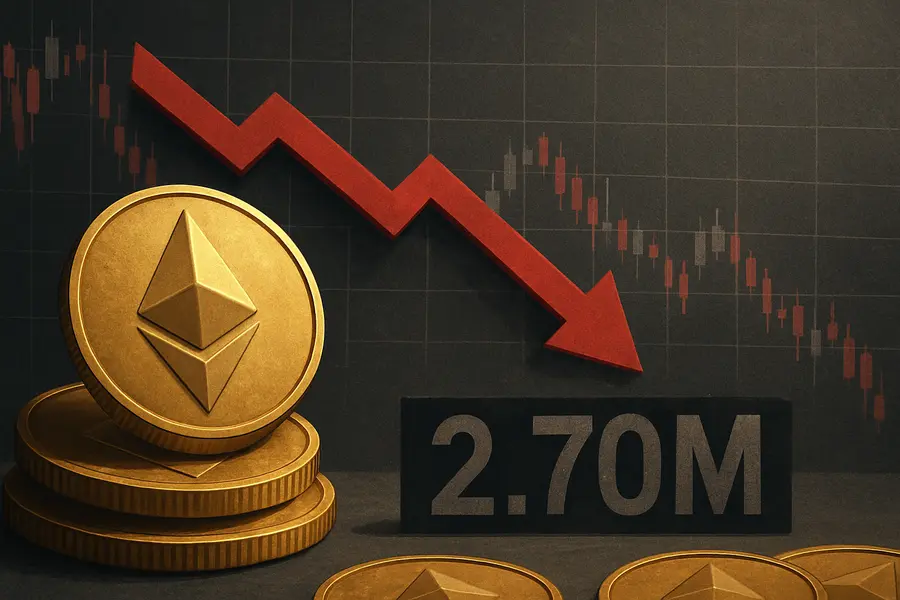
Ethereum's June 2026 sell-off triggers 2.70 million forced liquidations across global derivatives markets as ETH sinks below $1,580, with overleveraged long positions absorbing the bulk of the damage.
- ETH fell to an intraday low of $1,512 on June 28, posting an 8.18% loss in 24 hours and a 9.30% decline over seven days.
- Long positions accounted for more than 91% of all liquidations as overleveraged bulls faced forced exits across major derivatives exchanges.
- ETH now trades below its 20-, 50-, 100-, and 200-day exponential moving averages, the broadest bearish technical alignment of 2026.
Lead
Ethereum shed more than 8% in a single session on June 28, 2026, pushing the second-largest cryptocurrency below $1,566 and triggering 2.70 million individual liquidations across global futures markets. The cascade of forced selling wiped out hundreds of millions of dollars in open ETH positions within hours, extending a punishing second-quarter decline that has now carried the digital asset more than 9% lower over the past seven days. The episode ranks among the most widespread forced-exit events of the year by the number of market participants affected.What Happened
ETH dropped from an intraday opening near $1,568 to a session low of $1,512 before stabilizing in the mid-$1,560s — still decisively below the $1,600 level that had served as a floor earlier in June. Trading volume surged as margin calls swept through leveraged long books, converting an already weak market into a rout. More than 91% of all Ethereum liquidations during the session came from long positions: traders caught betting on a recovery that did not arrive.The Ethereum sell-off occurred within a broader crypto market collapse. A single 24-hour window earlier this week saw more than $861 million in total positions liquidated across digital assets, with long bets absorbing the overwhelming share of losses. Bitcoin took heavy damage in parallel, though ETH's structural leverage made its derivatives markets especially prone to cascading exits.
Market Reaction
Risk appetite across the crypto complex has deteriorated sharply through the month. The Fear & Greed Index fell to 16 — deep inside "extreme fear" territory — as the June rout gathered momentum. U.S.-listed spot bitcoin ETFs logged thirteen consecutive sessions of net outflows, reflecting institutional reallocation away from digital assets toward gold and short-duration debt. Ethereum futures open interest contracted significantly as positions unwound, thinning the market's capacity to absorb further selling pressure.
The ETH price volatility is not isolated to a single session. Since breaking below the psychologically critical $2,000 support level in late May, Ethereum has been in free fall. A confirmed death cross formed in early June, and long-term holders have steadily reduced exposure as each attempted recovery failed to hold.
Technical Picture
ETH now sits below its 20-day EMA at $1,708, 50-day EMA at $1,865, 100-day EMA at $2,037, and 200-day EMA at $2,317 — a complete breakdown across all four key trend indicators spanning short, medium, and long timeframes. This configuration has historically corresponded to extended bearish phases rather than brief corrections. Immediate technical resistance sits at $1,600; a failure to reclaim that level exposes the market to a retest of the June 28 intraday low near $1,512.Strategic Context
The current episode sits within a year defined by extreme leverage and recurrent forced-liquidation shocks. In February 2026, a single session saw ETH fall 17% and wipe out more than $1.15 billion in positions, including a reported $220 million loss attributed to a single trader — the largest single-position liquidation event in Ethereum's history. In January, approximately $1.68 billion in positions across the crypto market were liquidated in 24 hours, with 93% concentrated in longs. The structural pattern is consistent: high leverage embedded in bull markets creates asymmetric downside when sentiment shifts.
Broader Risk-Off Environment
The crypto long liquidations unfolded against a backdrop of deteriorating macro conditions. Geopolitical uncertainty — centered on U.S.-Iran tensions — has reduced appetite for speculative risk across asset classes. An AI chip sector sell-off earlier this month pulled institutional capital toward defensive positioning, with cross-market correlations between technology equities and digital assets amplifying the move lower in ETH and the broader crypto market.
The structural dynamic at work is straightforward: when participants employ leverage of ten to one hundred times their underlying capital, even modest adverse price moves trigger margin calls. Those liquidations generate additional selling, which triggers further margin calls — a feedback loop that converts an orderly decline into a disorderly rout. Ethereum's deep derivatives market makes it particularly susceptible to this mechanism relative to smaller digital assets.
Outlook
The technical and sentiment backdrop for Ethereum remains negative entering July 2026. All major moving averages signal continued bearish control, ETF flows show no sign of reversal, and the scale of ETH price volatility recorded over the past month suggests the market has not yet established a durable floor. A decisive close above $1,600 would represent the first meaningful evidence that forced deleveraging is abating. Until that threshold is reclaimed on volume, the probability of further crypto long liquidations and additional Ethereum market pressure outweighs the case for a sustained recovery.
Mentioned tickers: ETH, BTCMarkets }}