Pomegra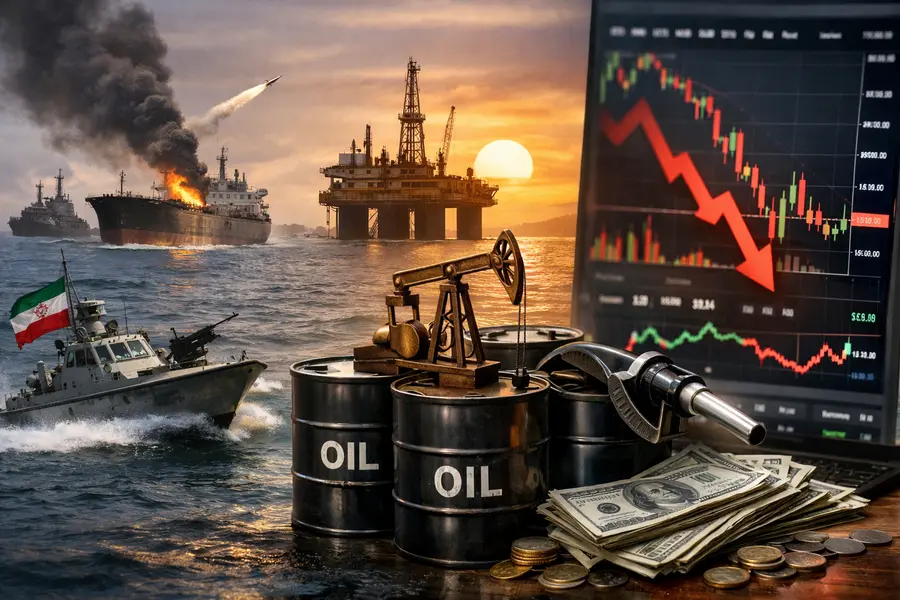
Hormuz closure strips 10 mb/d from global oil supply, drives Brent to $144, and forces a sharp safe haven rotation reshaping investor sentiment in 2026.
- Global oil supply plummeted 10.1 mb/d to 97 mb/d in March 2026, the largest single-month disruption in IEA history, as Hormuz tanker traffic ceased.
- Brent crude surged from a pre-conflict range of $65–$75 to a wartime high of $144/bbl before a sharp pullback, creating extreme energy flow disruption volatility.
- Gold's safe-haven role has inverted near $4,015/oz as inflation expectations tied to energy prices suppress its appeal, while energy equities absorb rotation flows.
Lead
The closure of the Strait of Hormuz following joint U.S.-Israeli air strikes on Iran on February 28, 2026 has produced the most severe energy flow disruption in the recorded history of global oil markets. The International Energy Agency confirmed that global oil supply plummeted 10.1 million barrels per day to 97 mb/d in March — stripping roughly 10 percent of global supply in a single month and triggering a wave of global market volatility that has yet to fully subside. Brent crude swung from a pre-conflict range of $65 to $75 per barrel to a wartime high of $144 per barrel before pulling back sharply, leaving markets in one of the most disorienting energy trading environments since the 1970s crises.
What Happened
Through the Strait of Hormuz transits approximately 20 percent of all globally traded crude oil — 17 to 21 million barrels per day — with no alternative routing infrastructure operating at comparable scale. When Iran halted tanker traffic through the waterway in response to the February 28 strikes, the supply shock propagated into energy and commodity markets within hours and began cascading through industrial economies within weeks.
The disruption immediately severed supply flows to energy-importing regions across Europe and Northeast Asia, forcing emergency draws on strategic petroleum reserves and a rapid reorientation of LNG procurement. The IEA coordinated reserve releases among consuming nations, though officials acknowledged the measures addressed immediate liquidity gaps rather than the structural supply deficit created by the Hormuz shutdown.
The IEA has since revised world oil demand forecasts downward: demand is now projected to contract 80 kb/d versus prior-year levels — 730 kb/d below the pre-war projection — as elevated prices destroyed consumption across Middle East and Asia-Pacific markets, particularly in naphtha, LPG, and jet fuel.
Market Reaction
Equity markets have not sold off uniformly. The defining feature of 2026 equity trading has been sector rotation driven by the energy shock rather than broad-based capitulation. Energy stocks emerged as the singular outperformer across major indices: with crude prices elevated, integrated oil majors and E&P companies are generating free cash flow that has attracted genuine fundamental reallocation, not merely defensive positioning.The technology sector — and semiconductors in particular — bore the heaviest correction. The PHLX Semiconductor Index had surged approximately 65 percent in the first half of 2026 before reversing sharply in July, falling more than 18 percent in the month. Semiconductors carry a near-20 percent weighting in the S&P 500, making their drawdown a primary amplifier of index-level volatility even as underlying earnings remained robust. TSMC reported Q2 net profit up 77 percent year-on-year as of July 16; the sector as a whole posted aggregate earnings growth near 133 percent in the quarter. With semiconductors accounting for roughly 44 percent of projected S&P 500 Q2 earnings growth, their price correction has generated outsized index volatility relative to underlying fundamentals.
Overall S&P 500 Q2 earnings growth is projected at 23.3 percent year-on-year, though the market's concentration risk has amplified rotational swings far beyond what that headline figure suggests.
The Safe-Haven Paradox
The 2026 conflict cycle has upended conventional safe haven rotation mechanics. Gold, which historically rallies on geopolitical escalation, fell approximately 2 percent in a single session following mid-July airstrikes near the Strait, with prices hovering near $4,015 per ounce — well below the elevated levels many institutional managers had anticipated for an active military conflict period.
The mechanism is structural, not anomalous. Sustained high oil prices feed directly into consumer price indices across advanced economies, hardening expectations for extended central bank tightening cycles. A stronger U.S. dollar in turn suppresses gold, which carries no yield and is priced in dollars. The result is an asset that historically absorbs geopolitical fear now behaving as a macro risk-sensitive instrument during the very shock that would once have powered its rally.
Investor sentiment 2026 has bifurcated as a result. Energy equities, short-duration fixed income, and select commodity-linked currencies have absorbed the safe haven rotation flows that gold and long-duration government bonds typically capture in classical risk-off episodes.Geopolitical Dimension
The 2026 energy shock has drawn persistent comparisons to the 1973 and 1979 oil crises. As in those episodes, the energy flow disruption has cascaded well beyond commodity markets into currency volatility, industrial output headwinds, and emerging market sovereign stress, with several central banks intervening to limit exchange rate deterioration tied to large energy import bills.
The Hormuz shutdown has simultaneously accelerated structural policy debates on energy security. European Union and Japanese officials have intensified discussions around alternative supply corridors, expanded strategic reserves, and accelerated renewable capacity additions — a trend that the pre-conflict era of relatively stable oil prices had decelerated. Diplomatically, no ceasefire framework had been finalized as of mid-July, and benchmark crude prices have continued to gyrate sharply on each negotiation signal.
Investor Sentiment 2026
Global market volatility has become the defining condition of the 2026 investment environment. Portfolio managers who entered the year heavily positioned in AI infrastructure and semiconductor names have had to restructure allocations in real time as the energy shock rewrote macro assumptions about inflation trajectories, central bank paths, and corporate cost structures. The equal-weighted S&P 500 and small-cap benchmarks have demonstrated relative resilience as capital broadened beyond concentrated mega-cap technology exposures — a widening that analysts note is structurally healthier for sustained market function, even if the transition is painful in the near term.
Outlook
The 2026 energy shock has moved from acute crisis to embedded structural uncertainty. Global market volatility is unlikely to normalize until a durable diplomatic resolution in the Strait of Hormuz materializes and tanker traffic resumes at scale. Until that point, energy sector leadership, persistent inflationary pressure on central bank policy, and the paradoxical suppression of gold's safe-haven role are likely to define the investment landscape. The episode marks a structural inflection: the energy flow disruption of 2026 has reset assumptions about supply security, the mechanics of safe haven rotation, and the fragility of globalized commodity systems that underpin modern industrial economies.
Mentioned tickers: SPY, XLE, GLD, USO, TSM, NVDA