
438 entries
Technical analysis
Chart-based analysis — candlesticks, support and resistance, patterns, indicators, oscillators.
- 52-Week High and Low as Support and Resistance How the annual 52-week high and low function as visible reference levels that attract trading activity, breakouts, and reversals in price action.
- AB=CD Pattern A harmonic structure where the second price leg mirrors the first in length and duration, setting a reversal zone.
- Abandoned Baby A three-candle reversal pattern where an isolated doji gaps away from both adjacent candles, signalling trend exhaustion.
- Accumulation Distribution A price-volume indicator that tracks whether institutional buying (accumulation) or selling (distribution) is happening within price movements.
- Accumulation/Distribution Line Volume-weighted price location indicator measuring whether volume is concentrated during up or down moves.
- Adaptive Moving Average A moving average that dynamically adjusts its smoothing speed based on the market's efficiency ratio, responding faster in trending markets and slower in choppy conditions.
- Advance-Decline Line A cumulative chart of advancing minus declining stocks, used to confirm price trends and expose internal market weakness or strength.
- Advance-Decline Line Divergence Explained Advance-decline line divergence meaning: when stock price makes a new high but fewer stocks participate, signaling weakening market breadth and potential reversal risk.
- Advance-Decline Line vs S&P 500 Divergence What advance-decline line divergence from the S&P 500 means, how it signals weakening market breadth, and why traders use it as a warning of broad market weakness ahead.
- Advance-Decline Ratio The daily ratio of advancing to declining issues, showing whether market breadth favours buyers or sellers at any moment.
- Advance-Decline Volume Line The advance decline volume line indicator weights the breadth movement by trading volume, revealing whether rallies are built on conviction.
- ADX Below 20: Using a Weak-Trend Filter to Avoid False Signals What an ADX reading below 20 means for trend strength, why trend crossovers fail in flat markets, and how traders use the threshold to switch off trend-following rules.
- ADX Directional Movement A technical indicator measuring the strength of a price trend (up or down), ranging from 0 to 100, independent of direction.
- ADX Rising vs Falling: What the Slope Reveals About Trend Strength How the direction of the ADX line — not just its level — signals whether a trend is strengthening or exhausting, with entry and exit implications.
- Anchored VWAP A volume-weighted average price reset to a specific event, letting traders track institutional cost basis and key price levels from that moment forward.
- Anchored VWAP Support and Resistance A dynamic VWAP indicator anchored to a key market event (earnings, breakout, crash) serving as institutional price interest.
- ARMS Ease of Movement Measure of how easily prices advance relative to market breadth, indicating whether gains are concentrated or broad-based.
- Aroon Indicator An oscillator measuring the elapsed time since a recent high or low to gauge trend strength and momentum.
- Aroon Indicator: How It Works Aroon indicator explained: Aroon Up and Aroon Down lines measure periods since the highest high and lowest low to identify trend freshness, fading, and consolidation.
- Aroon Oscillator vs Aroon Up/Down Lines Compare the single-line Aroon Oscillator and dual-line Aroon Up/Down indicator to understand which best captures trend strength and direction.
- Ascending Broadening Wedge A chart pattern where price makes higher highs and higher lows in a widening channel, often resolving bearish as volatility expands before reversal.
- Ascending triangle An ascending triangle is a bullish chart pattern with a rising lower trendline (support) and a flat upper trendline (resistance), converging toward a breakout.
- Ascending Triangle Pattern Chart pattern with a flat upper resistance line and rising lower support line, suggesting bullish continuation or reversal.
- Ascending Triangle Volume Confirmation What volume signals a valid ascending triangle breakout versus a false breakout, including declining volume interpretation during the pattern's formation.
- ATR True Range Average True Range measures volatility based on the largest of intraday moves and gaps, widely used for position sizing and stop placement.
- Average Directional Index (ADX) Explained Average Directional Index (ADX) explained: measures trend strength on a 0–100 scale without indicating direction; readings above 25 confirm tradeable trends.
- Average True Range (ATR) Explained How Average True Range measures volatility, how it is calculated from true ranges, and how traders use it for stops and position sizing.
- Awesome Oscillator Indicator Bill Williams' Awesome Oscillator: construction from moving average differences, saucer and zero-line setups, and application in momentum analysis.
- Bat Harmonic Pattern A harmonic price pattern completing at an 88.6% retracement of the primary leg, used to identify potential market reversals.
- Bear Flag Pattern A bear flag chart pattern signals a likely continuation of a downtrend after a brief consolidation, identified by a steep initial decline followed by a narrow trading range.
- Bearish Belt Hold Candlestick Pattern Learn how a bearish belt hold candlestick—a large bearish candle opening at the high—signals potential trend exhaustion in technical analysis.
- Bearish Engulfing Pattern at Resistance Levels A bearish engulfing pattern at resistance carries stronger reversal conviction than mid-trend patterns because the barrier to further upside is already established.
- Bearish Engulfing Pattern Explained Bearish engulfing candlestick pattern occurs when a large down candle engulfs the prior up candle's body. Learn the setup, context, and common misidentifications.
- Belt Hold A single-candle pattern that opens at its extreme and closes near the opposite end, signalling an abrupt shift in market sentiment—a reversal or continuation marker depending on context.
- Bill Williams Alligator Indicator Explained The Alligator indicator uses three smoothed moving averages to identify trending vs. ranging markets. Learn how the jaw, teeth, and lips work together in technical analysis.
- Bollinger Band Squeeze: What It Signals A bollinger band squeeze signal reveals when price volatility has contracted sharply, often preceding a major move. Learn how traders interpret the breakout.
- Bollinger Bands A volatility envelope around a moving average that tightens in low-volatility periods and widens during high volatility, marking support and resistance dynamically.
- Bond Market Advance-Decline Line Explained How the bond market advance-decline line tracks credit breadth and signals shifts in risk appetite across fixed-income securities.
- Breadth Divergence in a Bull Market When a stock index rises but fewer stocks participate—breadth divergence warning signals—this pattern often precedes market reversals.
- Breadth Indicators for Small-Account Traders Practical breadth indicators for retail traders: which free tools work with limited data and how to act on them without expensive systems.
- Breadth Thrust Indicator A market-breadth signal triggered when advancing stocks surge relative to declining ones, suggesting potential upside momentum.
- Breadth Thrust Signals After a Bear Market Bottom Breadth thrust after a bear market bottom occurs when many stocks advance together, signaling a durable recovery versus a dead-cat bounce.
- Broadening Formation An expanding chart pattern of rising peaks and falling troughs signalling increasing volatility and market indecision.
- Broadening Wedge Pattern The broadening wedge chart pattern features diverging trendlines forming a megaphone shape, signaling uncertainty and volatility expansion in technical analysis.
- Broken Support Becomes Resistance: The Role Reversal Principle When a price level that previously supported the market is decisively broken, it often reverses to act as resistance on any subsequent rally—a principle traders use to plan entries and stops.
- Bull Flag Target Calculation How to calculate bull flag price targets using the flagpole-to-flag measurement method, a core technical analysis technique for projecting breakout levels.
- Bull Flag vs Pennant: Key Differences How to distinguish a bull flag (parallel channel) from a pennant (converging trendlines), including formation time, volume signature, and price target calculations.
- Bullish Engulfing Pattern at Support Levels How a bullish engulfing pattern at support levels increases the probability of sustained price recovery and bounce confirmation.
- Bullish Engulfing Pattern Explained A bullish engulfing candlestick pattern signals potential upward reversal when a larger bullish candle fully covers the prior bearish candle's range.
- Bullish Percent Index The percentage of stocks in an index generating Point-and-Figure buy signals, measuring the breadth of positive technical setup across individual names.
- Bump-and-Run Reversal A three-phase topping pattern where a steep speculative run collapses back to a gradual lead-in trendline, signalling trend reversal.
- Buying Volume vs Selling Volume: How Traders Distinguish Them Understand how buying volume vs selling volume in trading is classified using tick rules and uptick/downtick methods to interpret momentum.
- Camarilla Pivot Levels An intraday pivot formula using a proprietary multiplier to generate tighter support and resistance bands than classical pivot points.
- Candlestick Body Size and What It Reveals About Momentum Candlestick body size significance shows conviction behind a move. A large body signals committed buying or selling; a small body signals indecision.
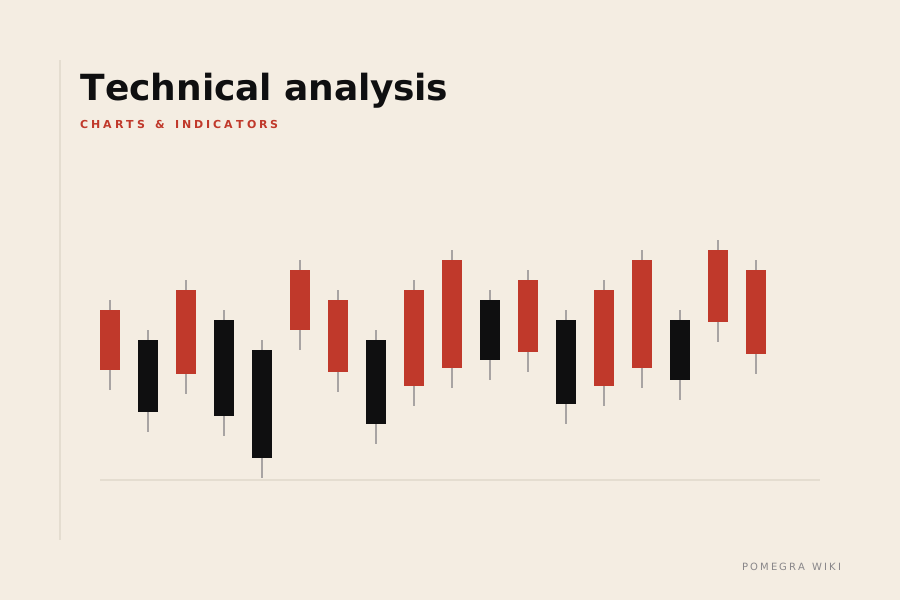
- Candlestick chart A candlestick chart is a style of price chart that displays the open, high, low, and close prices for each time period as a vertical bar with rectangular 'body' and thin 'wicks'.
- Candlestick Lower Shadow Meaning The candlestick lower shadow reveals intraday selling pressure and subsequent buying interest; its length relative to the body signals rejection of lower prices.
- Candlestick pattern A candlestick pattern is a recognizable sequence of candlestick shapes that traders interpret as signals of bullish or bearish reversals, continuations, or indecision.
- Candlestick Pattern Confirmation: When to Act on a Signal Candlestick pattern confirmation rules improve reliability by requiring volume checks, next-candle behavior, and indicator alignment before acting on a reversal or continuation setup.
- Candlestick Pattern Reliability by Timeframe How candlestick patterns on daily vs weekly charts show different statistical reliability. Longer timeframes reduce noise but limit trade frequency.
- Candlestick Wick-to-Body Ratio and What It Signals Learn how the candlestick wick to body ratio reveals buying and selling pressure intensity, and what extreme ratios tell traders about market psychology.
Looking for something specific? Use the search box up top, or browse every category →